SmartEPD-2025-077-0565-01.2Top-90 - flapDate of IssueJul 30, 2025Expiration dateJul 30, 2030Last updatedMar 06, 2026Refer to the EPD Library at www.smartepd.com for the latest EPD listing informationEnvironmental ProductDeclarationIN ACCORDANCE WITH ISO 14025 AND EN 15804:2012+A2:2019/AC:2021Program Operator: Smart EPD®www.smartepd.com
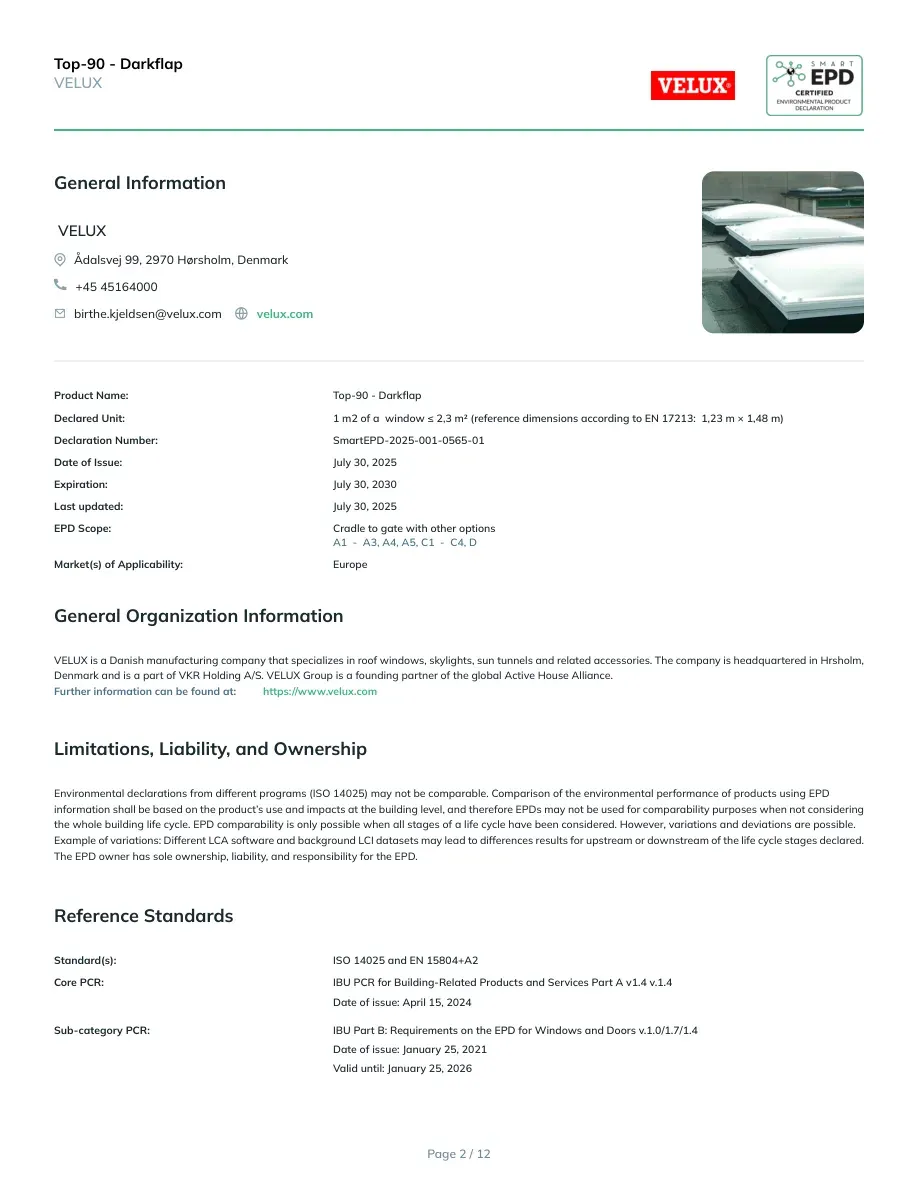
General InformationVELUXÅdalsvej 99, 2970 Hørsholm, Denmark+45 45164000epd.support@velux.comvelux.comProduct Name:Top-90 - flapDeclared Unit:1 m2 of a window ≤ 2,3 m² (reference dimensions according to EN 17213: 1,23 m × 1,48 m)Declaration Number:SmartEPD-2025-077-0565-01.2Date of Issue:July 30, 2025Expiration:July 30, 2030Last updated:March 06, 2026EPD Scope:Cradle to gate with other optionsA1 - A3, A4, A5, C1 - C4, DMarket(s) of Applicability:EuropeGeneral Organization InformationVELUX is a Danish manufacturing company that specializes in roof windows, skylights, sun tunnels and related accessories. The company is headquarteredin Hørsholm, Denmark and is a part of VKR Holding A/S. VELUX Group is a founding partner of the global Active House Alliance.Further information can be found at:https://www.velux.comLimitations, Liability and OwnershipEnvironmental declarations from different programs (ISO 14025) may not be comparable. Comparison of the environmental performance of products usingEPD information shall be based on the product’s use and impacts at the building level, and therefore EPDs may not be used for comparability purposes whennot considering the whole building life cycle. EPD comparability is only possible when all stages of a life cycle have been considered. However, variations anddeviations are possible. Example of variations: Different LCA software and background LCI datasets may lead to differences results for upstream ordownstream of the life cycle stages declared. The EPD owner has sole ownership, liability, and responsibility for the EPD.Reference StandardsStandard(s):ISO 14025 and EN 15804:2012+A2:2019/AC:2021Core PCR:IBU PCR for Building-Related Products and Services Part A v1.4 v.1.4Date of issue: April 15, 2024Sub-category PCR:IBU Part B: Requirements on the EPD for Windows and Doors v.1.0/1.7/1.4Date of issue: January 26, 2021Valid until: January 26, 2026Top-90 - flapVELUXPage 2 / 12
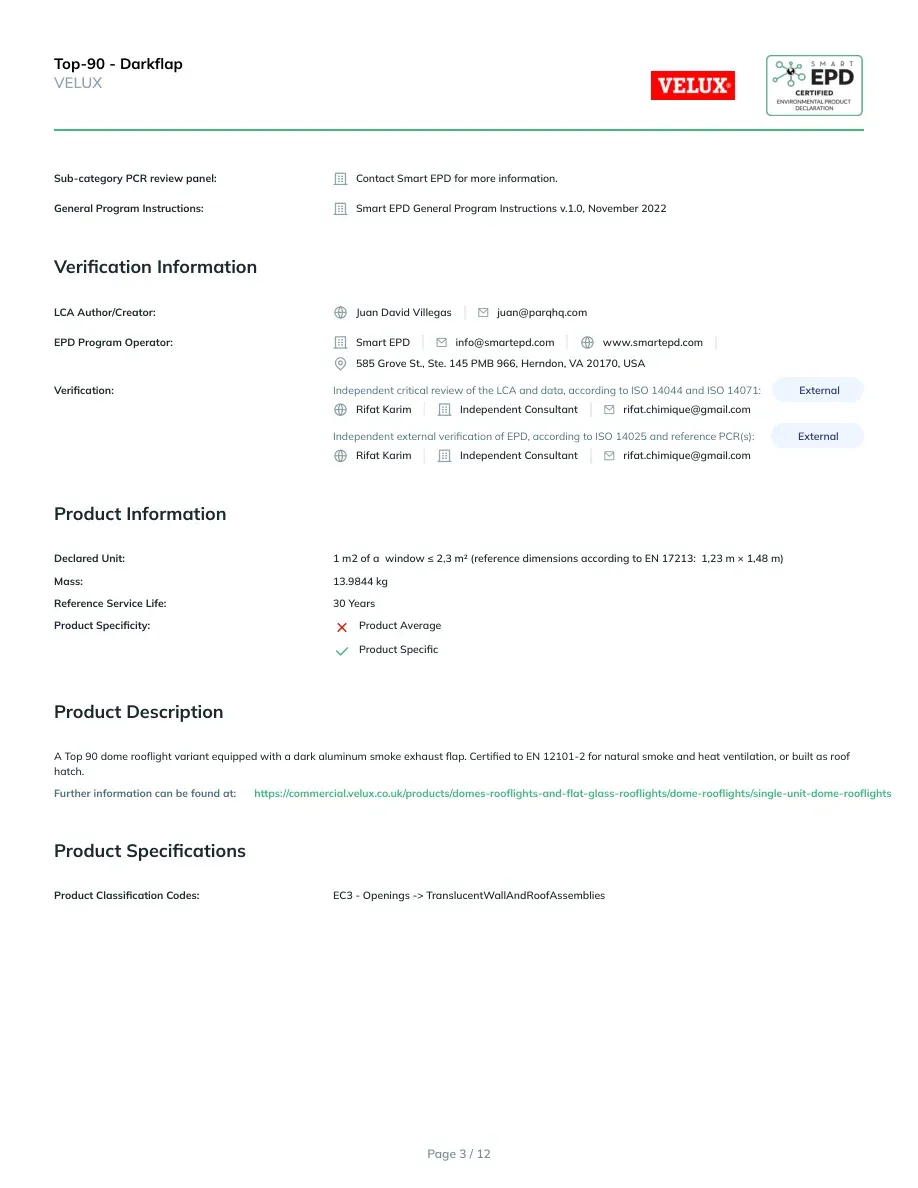
Sub-category PCR review panel:Contact Smart EPD for more information.General Program Instructions:Smart EPD General Program Instructions v.2.0, March 2025Verification InformationLCA Author/Creator:Samuel Fafelsamuel@parqhq.comEPD Program Operator:Smart EPDinfo@smartepd.comwww.smartepd.com585 Grove St., Ste. 145, Herndon, VA 20170, USAVerification:Independent critical review of the LCA and data, according to ISO 14044 andISO 14071:ExternalRifat KarimIndependent Consultantrifat.chimique@gmail.comIndependent external verification of EPD, according to ISO 14025 andreference PCR(s):ExternalAnna LassoSmart EPDanna.lasso@smartepd.comProduct InformationDeclared Unit:1 m2 of a window ≤ 2,3 m² (reference dimensions according to EN 17213: 1,23 m × 1,48 m)Mass:13.9844 kgReference Service Life:30 YearsProduct Specificity:Product AverageProduct SpecificProduct DescriptionA Top 90 dome rooflight variant equipped with a flat smoke exhaust flap. Certified to EN 12101-2 for natural smoke and heat ventilation, or built as roofhatch.Further information can befound at:https://commercial.velux.co.uk/products/domes-rooflights-and-flat-glass-rooflights/dome-rooflights/single-unit-dome-rooflightsProduct SpecificationsProduct Classification Codes:EC3 - Openings -> TranslucentWallAndRoofAssembliesTop-90 - flapVELUXPage 3 / 12
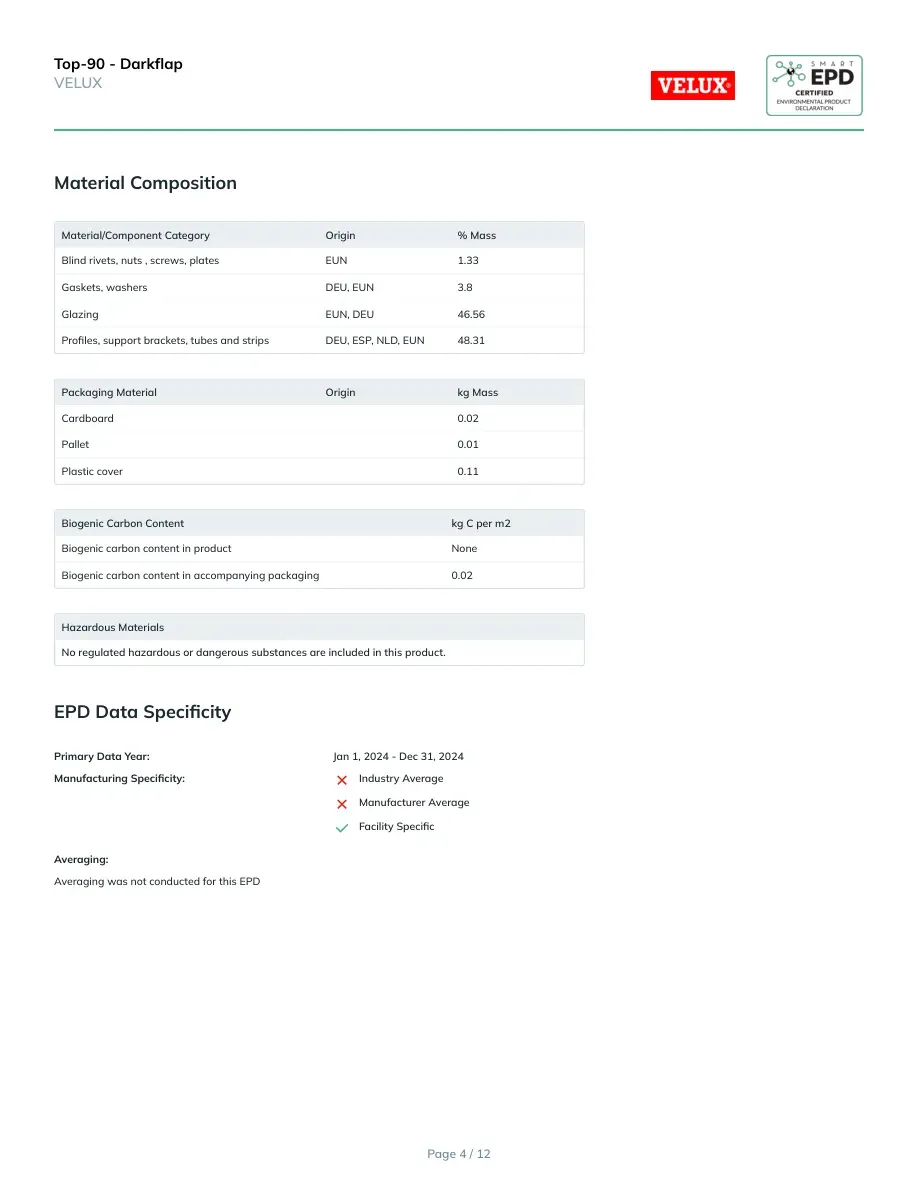
Material CompositionMaterial/Component CategoryOrigin% MassBlind rivets, nuts , screws, platesEUN1.33Gaskets, washersDEU, EUN3.8GlazingEUN, DEU46.56Profiles, support brackets, tubesand stripsDEU, ESP, NLD, EUN48.31Packaging MaterialOriginkg MassCardboard0.02Pallet0.01Plastic cover0.11Biogenic Carbon Contentkg C per m2Biogenic carbon content in product0NoneBiogenic carbon content in accompanyingpackaging0.02Hazardous MaterialsNo regulated hazardous or dangerous substances are included in this product.EPD Data SpecifityPrimary Data Year:Jan 1, 2024 - Dec 31, 2024Manufacturing Specificity:Industry AverageManufacturer AverageFacility SpecificAveraging:Averaging was not conducted for this EPDTop-90 - flapVELUXPage 4 / 12
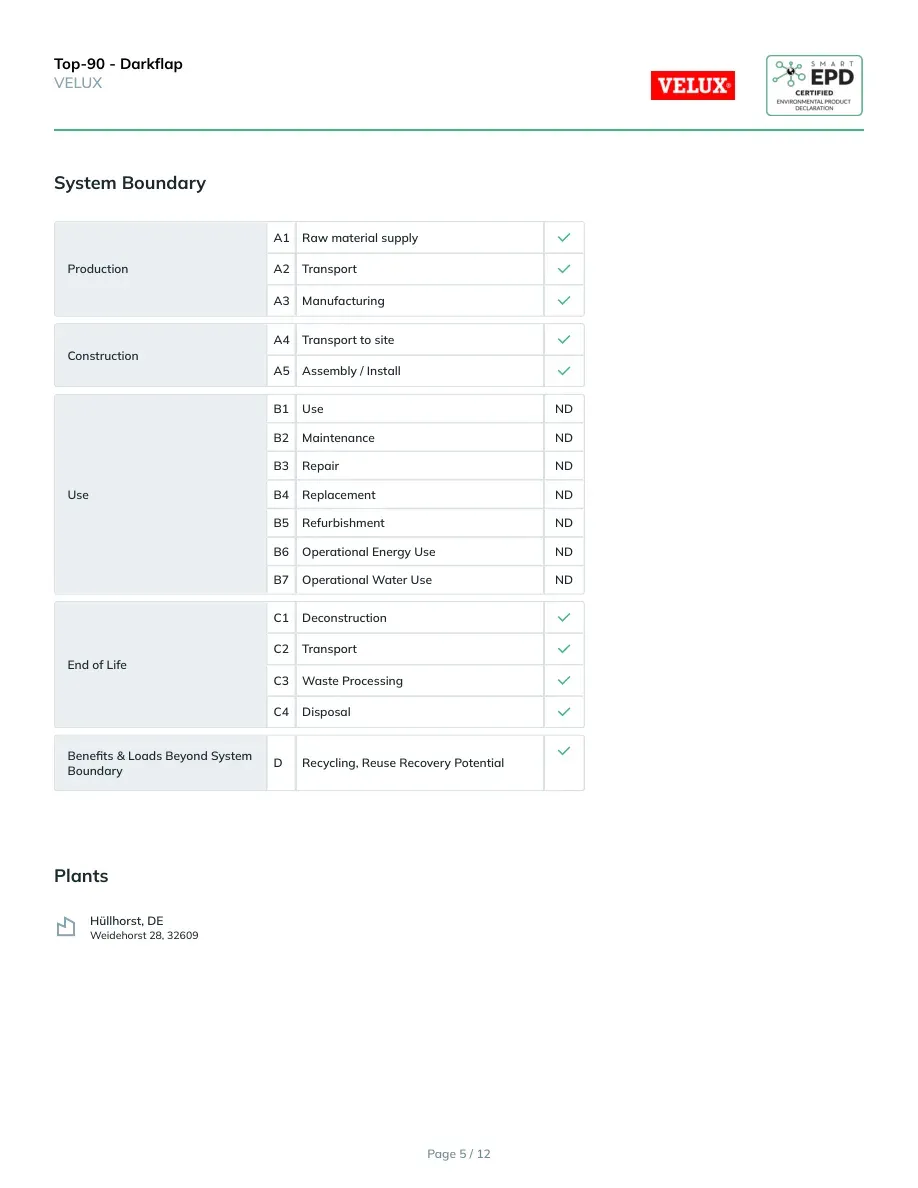
System BoundaryProductionA1Raw material supplyA2TransportA3ManufacturingConstructionA4Transport to siteA5Assembly / InstallUseB1UseNDB2MaintenanceNDB3RepairNDB4ReplacementNDB5RefurbishmentNDB6Operational Energy UseNDB7Operational Water UseNDEnd of LifeC1DeconstructionC2TransportC3Waste ProcessingC4DisposalBenefits & Loads BeyondSystem BoundaryDRecycling, Reuse Recovery PotentialNote:ND = Module not declaredPlantsHüllhorst, DEWeidehorst 28, 32609Top-90 - flapVELUXPage 5 / 12
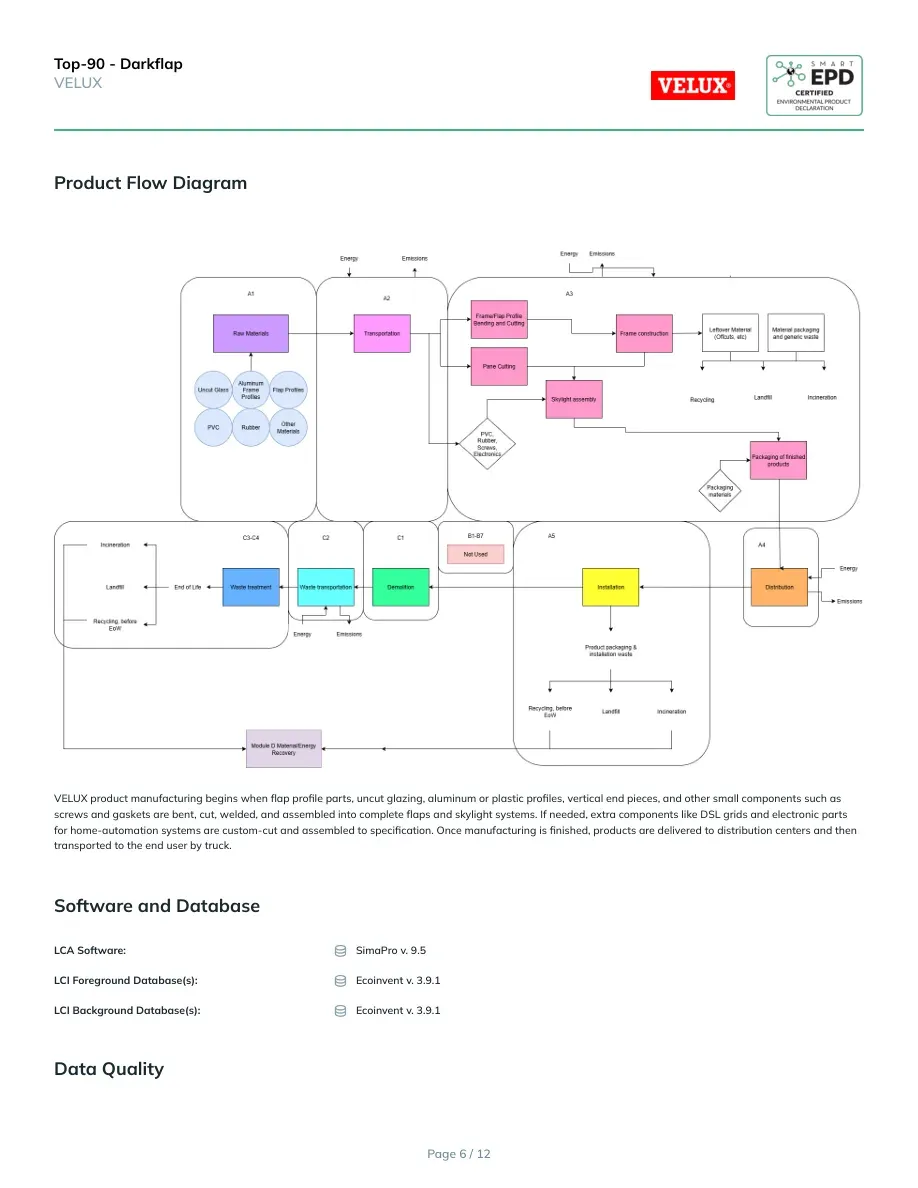
Product Flow DiagramVELUX product manufacturing begins when flap profile parts, uncut glazing, aluminum or plastic profiles, vertical end pieces, and other small componentssuch as screws and gaskets are bent, cut, welded, and assembled into complete flaps and skylight systems. If needed, extra components like DSL grids andelectronic parts for home-automation systems are custom-cut and assembled to specification. Once manufacturing is finished, products are delivered todistribution centers and then transported to the end user by truck.Software And DatabaseLCA Software:SimaPro v. 9.5LCI Foreground Database(s):Ecoinvent v. 3.9.1LCI Background Database(s):Ecoinvent v. 3.9.1A foreground LCI database is the database used to model the primary, site-specific data collected for this EPD. A background LCI database is the databaseused to model generic or non-specific data.Top-90 - flapVELUXPage 6 / 12
Data QualityPrecision & CompletenessPrecision: Inventory data were directly measured, calculated, or conservatively estimated from primary sources using consistent units and QA checks.Background processes from ecoinvent v3 were adopted with their documented uncertainty/precision metadata where available, preserving atransparent record of data quality.Completeness: The product system's mass balance and inventory completeness were thoroughly checked. Some exclusions were made in line with thePCR requirements, such as personnel impacts, R&D activities, business travel, and point-of-sale infrastructure. However, no data were intentionallyomitted.Consistency and ReproducibilityConsistency: Primary data for all modules were consistently gathered aiming at the highest level of detail possible. Background processes weremodeled mainly with the ecoinvent database. The same allocation rules, cut-off criteria, and impact assessment methods were applied throughout,ensuring methodological coherence and consistent data quality across the entire LCA model.Reproducibility: This study ensures reproducibility by providing comprehensive disclosure of input–output data, dataset choices, and modelingapproaches. A knowledgeable third party should be able to approximate the results using the same data and modeling methods.RepresentativenessTemporal: Primary data were collected for a 12-month period representing the 2024 calendar year to ensure the representativeness of post-consumercontent. Secondary data from the ecoinvent v3 database are typically representative of recent years.Geographical: Primary data represent VELUX's production facilities. Where applicable, differences in electric grid mix were considered usingappropriate secondary data. The use of country-specific data ensures high geographical representativeness, and proxy data were only used whencountry-specific data were unavailable.Technological: Both primary and secondary data were tailored to the specific technologies studied, ensuring high technological representativeness.Life Cycle Module DescriptionModules A1–A3: The LCA model covers the manufacture of raw materials and components for VELUX products (A1) which are then transported to VELUXfacilities by truck (A2). The manufacturing stage (A3) begins with receipt of these materials, which are bent, cut, welded, and assembled into finished flapsand skylight systems. When required, additional parts like DSL grids and electronic components for home-automation systems are custom-cut andassembled to order.Modules A4–A5: Once manufacture is completed, products are shipped to distribution centers and then to the end user by truck (A4). For installation (A5), a3% material installation loss was assumed. This module includes disposal of that waste and of the product packaging.Modules C1–C4 and D: At end of life (C1–C4), the product is assumed to be collected, and each waste stream (e.g., aluminum, glass, PVC) is handledseparately—landfilled, recycled, or incinerated with energy recovery. Loads and benefits beyond the system boundary are considered in Module D (e.g.,displacement of virgin materials and electricity).LCA DiscussionAllocation ProcedureAllocation of co-products was avoided, to the extent possible, based on the guidance given in ISO 14044:2006, 4.3, and in EN 15804+A2:2019. Energy useat the facility level was allocated by the amount of product produced. The manufacturing process does not consume water or generate wastewater or airemissions, other than those from fuel combustion. Solid waste was estimated using packaging masses and material losses and allocated following thepolluter pays principle.Top-90 - flapVELUXPage 7 / 12
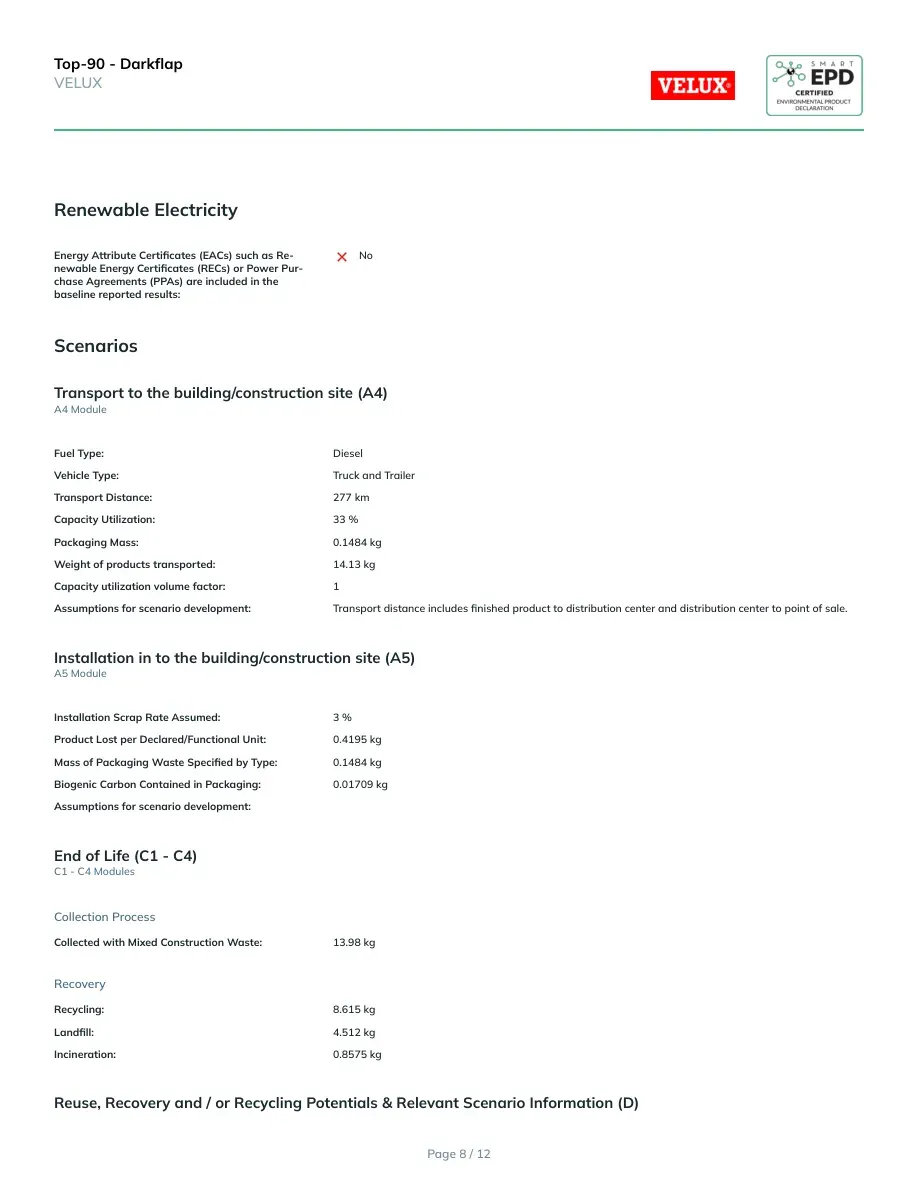
Cut-off ProcedureThe system boundary was defined based on relevance to the goal of the study. For the raw material (A1) and process related inputs (A3), all availableenergy and material flow data have been included in the model.Renewable ElectricityEnergy Attribute Certificates (EACs) such asRenewable Energy Certificates (RECs) or PowerPurchase Agreements (PPAs) are included in thebaseline reported results:NoScenariosTransport to the building/construction site (A4)A4 ModuleFuel Type:DieselVehicle Type:Truck and TrailerTransport Distance:277 kmCapacity Utilization:33 %Packaging Mass:0.1484 kgWeight of products transported:14.13 kgCapacity utilization volume factor:1Assumptions for scenario development:Transport distance includes finished product to distribution center and distribution center to pointof sale.Installation in to the building/construction site (A5)A5 ModuleInstallation Scrap Rate Assumed:3 %Product Lost per Declared/Functional Unit:0.4195 kgMass of Packaging Waste Specified by Type:0.1484 kgBiogenic Carbon Contained in Packaging (kg C):0.01709 kgAssumptions for scenario development:Reuse, Recovery and / or Recycling Potentials & Relevant Scenario Information (D)D ModuleRecycling Rate of Product:0.6161 %Recycled Content of Product:0.006364 %Net Energy Benefit from Material Flow Declared inC3 for Energy Recovery:40.16 MJTop-90 - flapVELUXPage 8 / 12
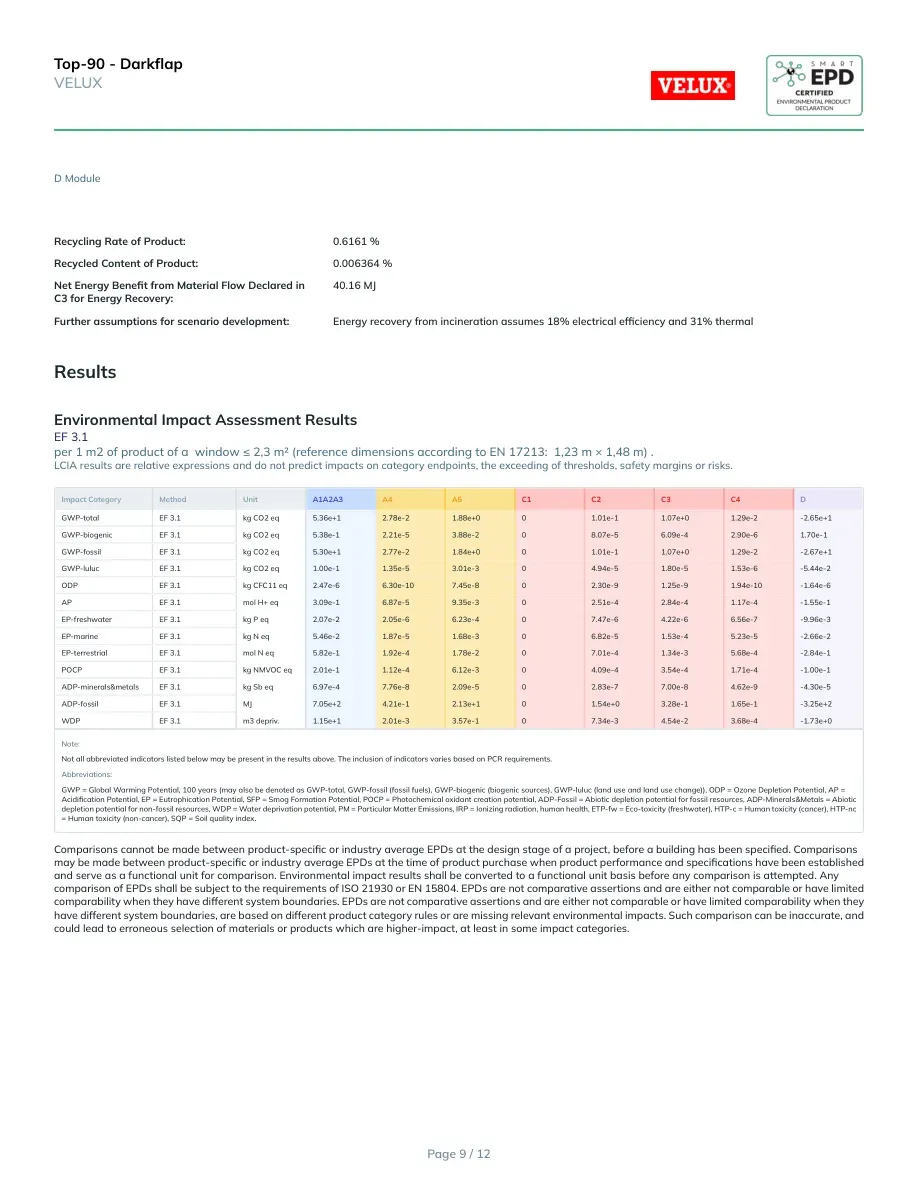
Further assumptions for scenario development:Energy recovery from incineration assumes 18% electrical efficiency and 31% thermalResultsEnvironmental Impact Assessment ResultsEF 3.1per 1 m2 of product of a window ≤ 2,3 m² (reference dimensions according to EN 17213: 1,23 m × 1,48 m) .LCIA results are relative expressions and do not predict impacts on category endpoints, the exceeding of thresholds, safety margins or risks.Impact CategoryMethodIndicatorA1 - A3A4A5C1C2C3C4DGWP-totalEF 3.1ND5.36e+12.78e-21.88e+001.01e-11.07e+01.29e-2-2.65e+1GWP-biogenicEF 3.1ND5.38e-12.21e-53.88e-208.07e-56.09e-42.90e-61.70e-1GWP-fossilEF 3.1ND5.30e+12.77e-21.84e+001.01e-11.07e+01.29e-2-2.67e+1GWP-lulucEF 3.1ND1.00e-11.35e-53.01e-304.94e-51.80e-51.53e-6-5.44e-2ODPEF 3.1ND2.47e-66.30e-107.45e-802.30e-91.25e-91.94e-10-1.64e-6APEF 3.1ND3.09e-16.87e-59.35e-302.51e-42.84e-41.17e-4-1.55e-1EP-freshwaterEF 3.1ND2.07e-22.05e-66.23e-407.47e-64.22e-66.56e-7-9.96e-3EP-marineEF 3.1ND5.46e-21.87e-51.68e-306.82e-51.53e-45.23e-5-2.66e-2EP-terrestrialEF 3.1ND5.82e-11.92e-41.78e-207.01e-41.34e-35.68e-4-2.84e-1POCPEF 3.1ND2.01e-11.12e-46.12e-304.09e-43.54e-41.71e-4-1.00e-1ADP-minerals&metalsEF 3.1ND6.97e-47.76e-82.09e-502.83e-77.00e-84.62e-9-4.30e-5ADP-fossilEF 3.1ND7.05e+24.21e-12.13e+101.54e+03.28e-11.65e-1-3.25e+2WDPEF 3.1ND1.15e+12.01e-33.57e-107.34e-34.54e-23.68e-4-1.73e+0Note:Not all abbreviated indicators listed below may be present in the results above. The inclusion of indicators varies based on PCR requirements.Abbreviations:GWP = Global Warming Potential, 100 years (may also be denoted as GWP-total, GWP-fossil (fossil fuels), GWP-biogenic (biogenic sources), GWP-luluc (land use and land use change)), ODP = Ozone DepletionPotential, AP = Acidification Potential, EP = Eutrophication Potential, SFP = Smog Formation Potential, POCP = Photochemical oxidant creation potential, ADP-Fossil = Abiotic depletion potential for fossil resources,ADP-Minerals&Metals = Abiotic depletion potential for non-fossil resources, WDP = Water deprivation potential, PM = Particular Matter Emissions, IRP = Ionizing radiation, human health, ETP-fw = Eco-toxicity(freshwater), HTP-c = Human toxicity (cancer), HTP-nc = Human toxicity (non-cancer), SQP = Soil quality index.Comparisons cannot be made between product-specific or industry average EPDs at the design stage of a project, before a building has been specified.Comparisons may be made between product-specific or industry average EPDs at the time of product purchase when product performance andspecifications have been established and serve as a functional unit for comparison. Environmental impact results shall be converted to a functional unitbasis before any comparison is attempted. Any comparison of EPDs shall be subject to the requirements of ISO 21930 or EN 15804. EPDs are notcomparative assertions and are either not comparable or have limited comparability when they have different system boundaries. EPDs are notcomparative assertions and are either not comparable or have limited comparability when they have different system boundaries, are based on differentproduct category rules or are missing relevant environmental impacts. Such comparison can be inaccurate, and could lead to erroneous selection ofmaterials or products which are higher-impact, at least in some impact categories.Top-90 - flapVELUXPage 9 / 12
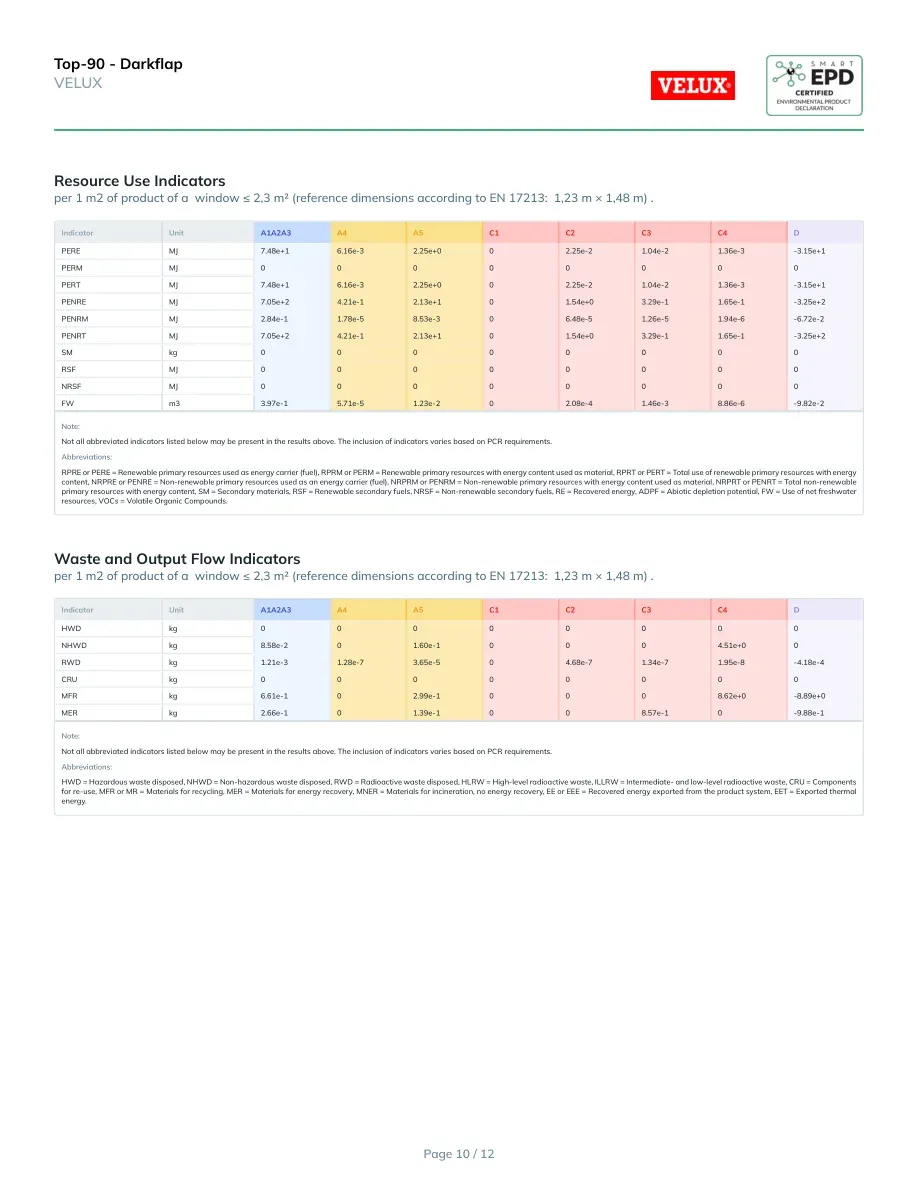
Resource Use Indicatorper 1 m2 of product of a window ≤ 2,3 m² (reference dimensions according to EN 17213: 1,23 m × 1,48 m) .IndicatorUnitA1 - A3A4A5C1C2C3C4DPEREMJ7.48e+16.16e-32.25e+002.25e-21.04e-21.36e-3-3.15e+1PERMMJ00000000PERTMJ7.48e+16.16e-32.25e+002.25e-21.04e-21.36e-3-3.15e+1PENREMJ7.05e+24.21e-12.13e+101.54e+03.29e-11.65e-1-3.25e+2PENRMMJ2.84e-11.78e-58.53e-306.48e-51.26e-51.94e-6-6.72e-2PENRTMJ7.05e+24.21e-12.13e+101.54e+03.29e-11.65e-1-3.25e+2SMkg00000000RSFMJ00000000NRSFMJ00000000FWm33.97e-15.71e-51.23e-202.08e-41.46e-38.86e-6-9.82e-2Note:Not all abbreviated indicators listed below may be present in the results above. The inclusion of indicators varies based on PCR requirements.Abbreviations:RPRE or PERE = Renewable primary resources used as energy carrier (fuel), RPRM or PERM = Renewable primary resources with energy content used as material, RPRT or PERT = Total use of renewable primaryresources with energy content, NRPRE or PENRE = Non-renewable primary resources used as an energy carrier (fuel), NRPRM or PENRM = Non-renewable primary resources with energy content used as material,NRPRT or PENRT = Total non-renewable primary resources with energy content, SM = Secondary materials, RSF = Renewable secondary fuels, NRSF = Non-renewable secondary fuels, RE = Recovered energy,ADPF = Abiotic depletion potential, FW = Use of net freshwater resources, VOCs = Volatile Organic Compounds.Waste and Output Flow Indicatorsper 1 m2 of product of a window ≤ 2,3 m² (reference dimensions according to EN 17213: 1,23 m × 1,48 m) .IndicatorUnitA1 - A3A4A5C1C2C3C4DHWDkg00000000NHWDkg8.58e-201.60e-10004.51e+00RWDkg1.21e-31.28e-73.65e-504.68e-71.34e-71.95e-8-4.18e-4CRUkg00000000MFRkg6.61e-102.99e-10008.62e+0-8.89e+0MERkg2.66e-101.39e-1008.57e-10-9.88e-1Note:Not all abbreviated indicators listed below may be present in the results above. The inclusion of indicators varies based on PCR requirements.Abbreviations:HWD = Hazardous waste disposed, NHWD = Non-hazardous waste disposed, RWD = Radioactive waste disposed, HLRW = High-level radioactive waste, ILLRW = Intermediate- and low-level radioactive waste,CRU = Components for re-use, MFR or MR = Materials for recycling, MER = Materials for energy recovery, MNER = Materials for incineration, no energy recovery, EE or EEE = Recovered energy exported from theproduct system, EET = Exported thermal energy.Top-90 - flapVELUXPage 10 / 12
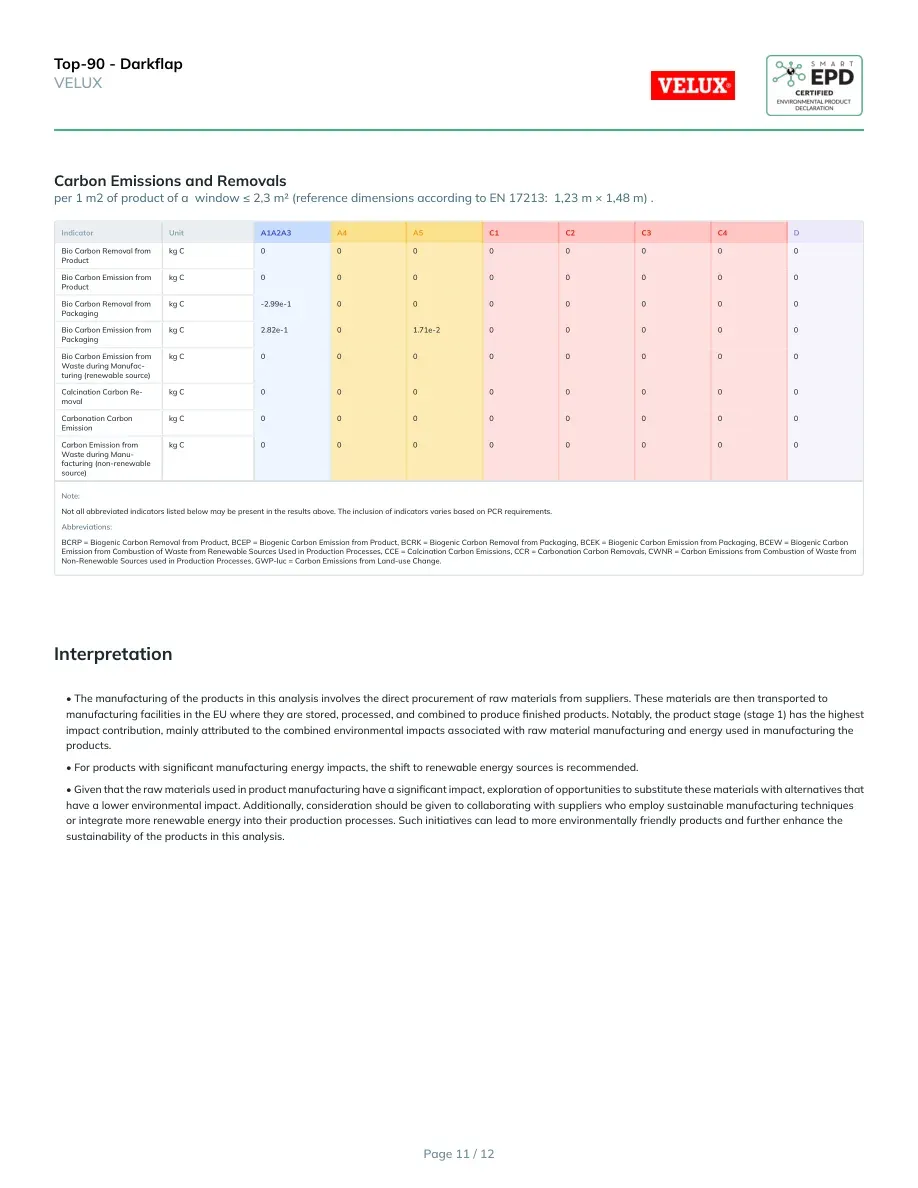
Carbon Emissions and Removalsper 1 m2 of product of a window ≤ 2,3 m² (reference dimensions according to EN 17213: 1,23 m × 1,48 m) .IndicatorUnitA1 - A3A4A5C1C2C3C4DBio Carbon Removal from Productkg C00000000Bio Carbon Emission from Productkg C00000000Bio Carbon Removal from Packagingkg C-2.99e-10000000Bio Carbon Emission from Packagingkg C2.82e-101.71e-200000Bio Carbon Emission from Waste duringManufacturing (renewable source)kg C00000000Calcination Carbon Removalkg C00000000Carbonation Carbon Emissionkg C00000000Carbon Emission from Waste duringManufacturing (non-renewable source)kg C00000000Note:Not all abbreviated indicators listed below may be present in the results above. The inclusion of indicators varies based on PCR requirements.Abbreviations:BCRP = Biogenic Carbon Removal from Product, BCEP = Biogenic Carbon Emission from Product, BCRK = Biogenic Carbon Removal from Packaging, BCEK = Biogenic Carbon Emission from Packaging, BCEW =Biogenic Carbon Emission from Combustion of Waste from Renewable Sources Used in Production Processes, CCE = Calcination Carbon Emissions, CCR = Carbonation Carbon Removals, CWNR = Carbon Emissionsfrom Combustion of Waste from Non-Renewable Sources used in Production Processes, GWP-luc = Carbon Emissions from Land-use Change.InterpretationThe manufacturing of the products in this analysis involves the direct procurement of raw materials from suppliers. These materials are thentransported to manufacturing facilities in the EU where they are stored, processed, and combined to produce finished products. Notably, the productstage (stage 1) has the highest impact contribution, mainly attributed to the combined environmental impacts associated with raw materialmanufacturing and energy used in manufacturing the products.For products with significant manufacturing energy impacts, the shift to renewable energy sources is recommended.Given that the raw materials used in product manufacturing have a significant impact, exploration of opportunities to substitute these materials withalternatives that have a lower environmental impact. Additionally, consideration should be given to collaborating with suppliers who employsustainable manufacturing techniques or integrate more renewable energy into their production processes. Such initiatives can lead to moreenvironmentally friendly products and further enhance the sustainability of the products in this analysis.0%20%40%60%80%100%GWP-TotalEF 3.1GWP-BiogenicEF 3.1GWP-FossilEF 3.1GWP-LulucEF 3.1ODPEF 3.1APEF 3.1EP-FreshwaterEF 3.1Top-90 - flapVELUXPage 11 / 12
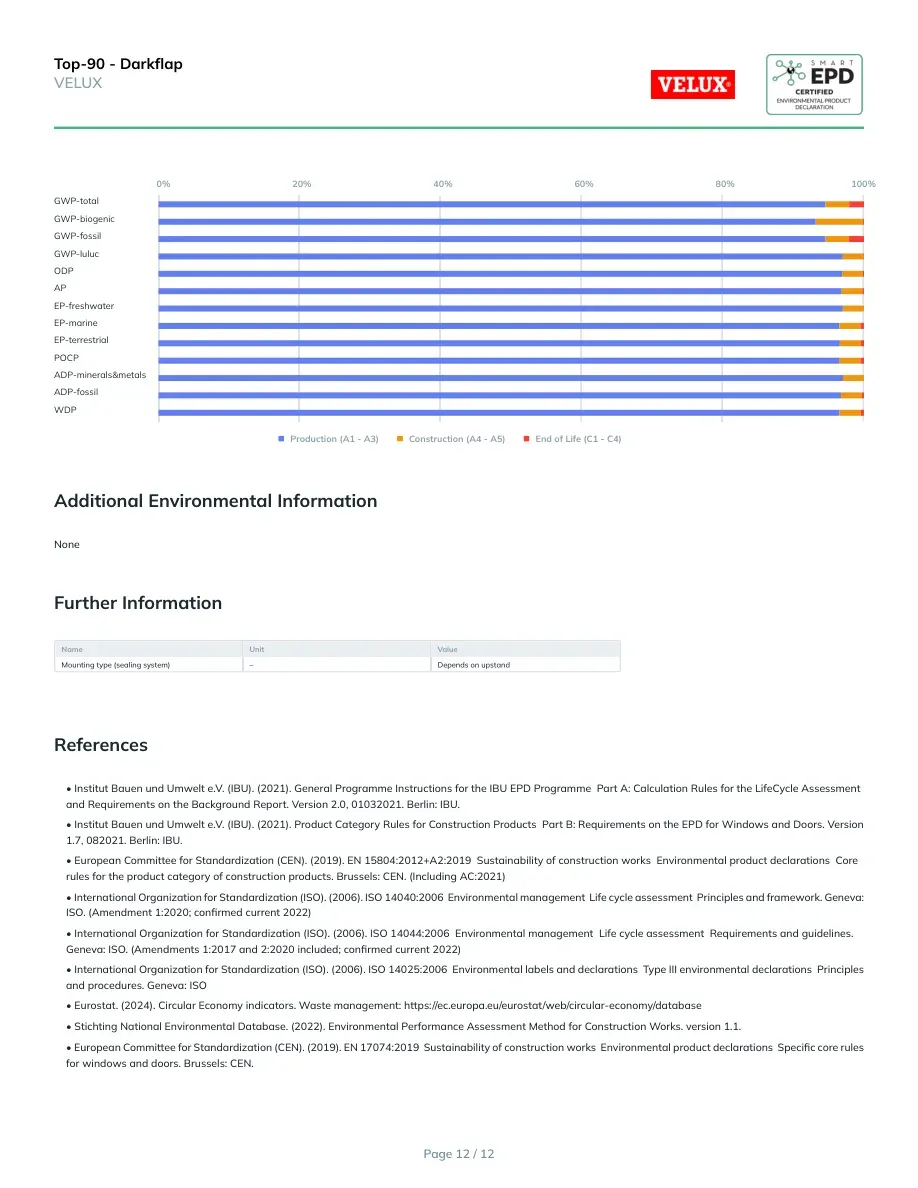
EP-MarineEF 3.1EP-TerrestrialEF 3.1POCPEF 3.1ADP-Minerals&MetalsEF 3.1ADP-FossilEF 3.1WDPEF 3.1Production (A1 - A3)Construction (A4 - A5)End of Life (C1 - C4)Additional Environmental InformationNoneFurther InformationNameUnitValueMounting type (sealing system)–Depends on upstandReferencesInstitut Bauen und Umwelt e.V. (IBU). (2021). General Programme Instructions for the IBU EPD Programme – Part A: Calculation Rules for the Life‐CycleAssessment and Requirements on the Background Report. Version 2.0, 01‑03‑2021. Berlin: IBU.Institut Bauen und Umwelt e.V. (IBU). (2021). Product Category Rules for Construction Products – Part B: Requirements on the EPD for Windows and Doors.Version 1.7, 08‑2021. Berlin: IBU.European Committee for Standardization (CEN). (2019). EN 15804:2012+A2:2019 – Sustainability of construction works – Environmental productdeclarations – Core rules for the product category of construction products. Brussels: CEN. (Including AC:2021)International Organization for Standardization (ISO). (2006). ISO 14040:2006 – Environmental management – Life cycle assessment – Principles andframework. Geneva: ISO. (Amendment 1:2020; confirmed current 2022)International Organization for Standardization (ISO). (2006). ISO 14044:2006 – Environmental management – Life cycle assessment – Requirements andguidelines. Geneva: ISO. (Amendments 1:2017 and 2:2020 included; confirmed current 2022)International Organization for Standardization (ISO). (2006). ISO 14025:2006 – Environmental labels and declarations – Type III environmental declarations –Principles and procedures. Geneva: ISOEurostat. (2024). Circular Economy indicators. Waste management: https://ec.europa.eu/eurostat/web/circular-economy/databaseStichting National Environmental Database. (2022). Environmental Performance Assessment Method for Construction Works. version 1.1.European Committee for Standardization (CEN). (2019). EN 17074:2019 – Sustainability of construction works – Environmental product declarations –Specific core rules for windows and doors. Brussels: CEN.Top-90 - flapVELUXPage 12 / 12
